Topological Analysis: Definitions
The basic mathematical concept which underpins the study of complex
networks in Biology is graph theory. Alongside the potential
benefits of applying graph theoretical methods in molecular biology,
it should be emphasized that the complexity of the networks
encountered in cellular biology and the mechanisms behind their
emergence presents the network researcher with numerous challenges
and difficulties.
Here we introduce most common used graph theory definitions which apply for topological analysis of biological networks.
|
Graph theory
is the study of graphs, mathematical structures used
to model pair wise relations between objects from a certain
collection. |
 |
|
A "graph" in this context refers to a collection of vertices
or 'nodes' and a collection of edges that connect
pairs of vertices. V = nodes (vertices, points).
E
= edges (links, arcs) between pairs of nodes.
graph size
parameters:
n = |V|, m = |E| |
 |
|
Example: V = { 1, 2, 3, 4, 5, 6, 7, 8 }
E = { {1,2}, {1,3}, {2,3}, {2,4}, {2,5}, {3,5}, {3,7},
{3,8}, {4,5}, {5,6} } m = 11 |
 |
|
A
subgraph
of a graph H is a graph whose
vertex set is a subset of that of G, and whose
adjacency relation is a subset of that of G
restricted to this subset. |
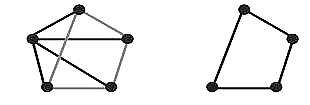 Subgraph |
|
Direction: Directed graph (digraph or oriented graph): It is a graph or set of nodes connected by edges, where the edges have a direction associated with them. In Biology, transcriptional regulatory networks and metabolic networks would usually be modeled as directed graphs. For instance, in a transcriptional regulatory network, nodes would represent genes with edges denoting the interactions between them. This would be a directed graph because, if gene A regulates gene B, then there is a natural direction associated with the edge between the corresponding nodes, starting at A and finishing at B. Undirected graph: An undirected graph is a graph in which edges have no orientation. PPI networks are typically modeled as undirected graphs, in which nodes represent proteins and edges represent interactions. |
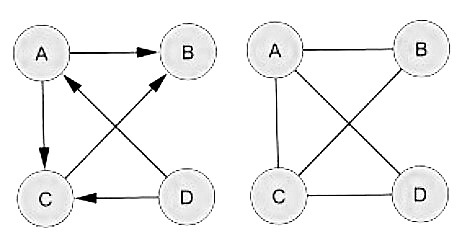 Directed vs Undirected |
|
Degree:
Undirected network:
Degree in an undirected network is simply the total number of edges at
a node.
Directed network:
For a directed graph, there are two types of degree; Incoming degree
(kin) which is number of edges that terminate at a node,
and Outgoing degree (kout ) which is number of edges that start from a node. |
 degree (undirected graph)  degree (directed graph) |
|
Weighted
graph
associates a label (weight) with every edge in the
graph |
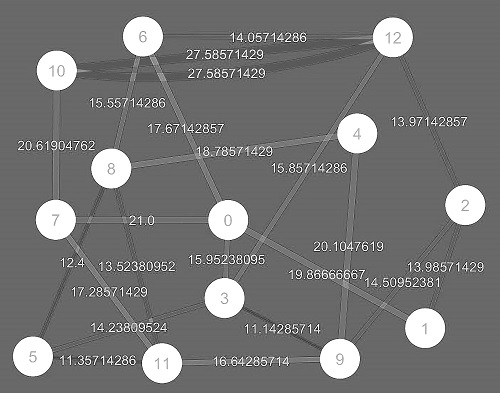 |
|
Graph Representation: Adjacency Matrix:is a means of representing which vertices (or nodes) of a graph are adjacent to which other vertices. Adjacency list:is a collection of unordered lists, one for each vertex in the graph. Each list describes the set of neighbors of its vertex. |
 Adjacency matrix  Adjacency list |
|
Biological Networks
|
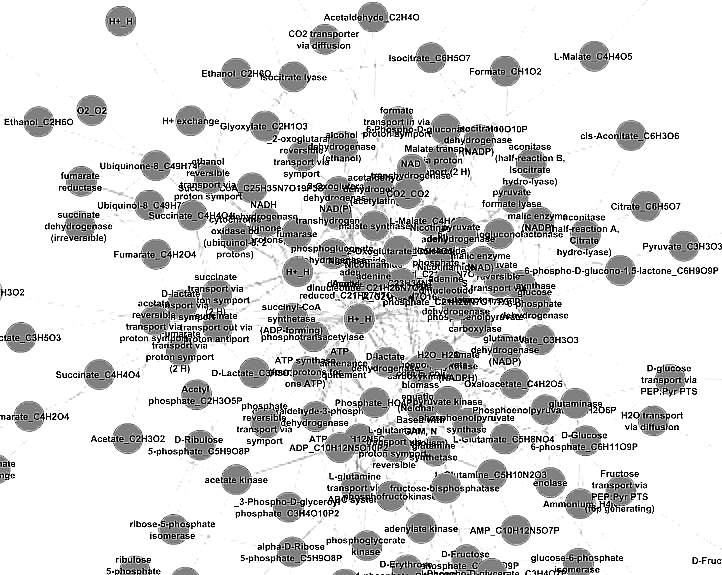 |
|
Global network properties |
|
|
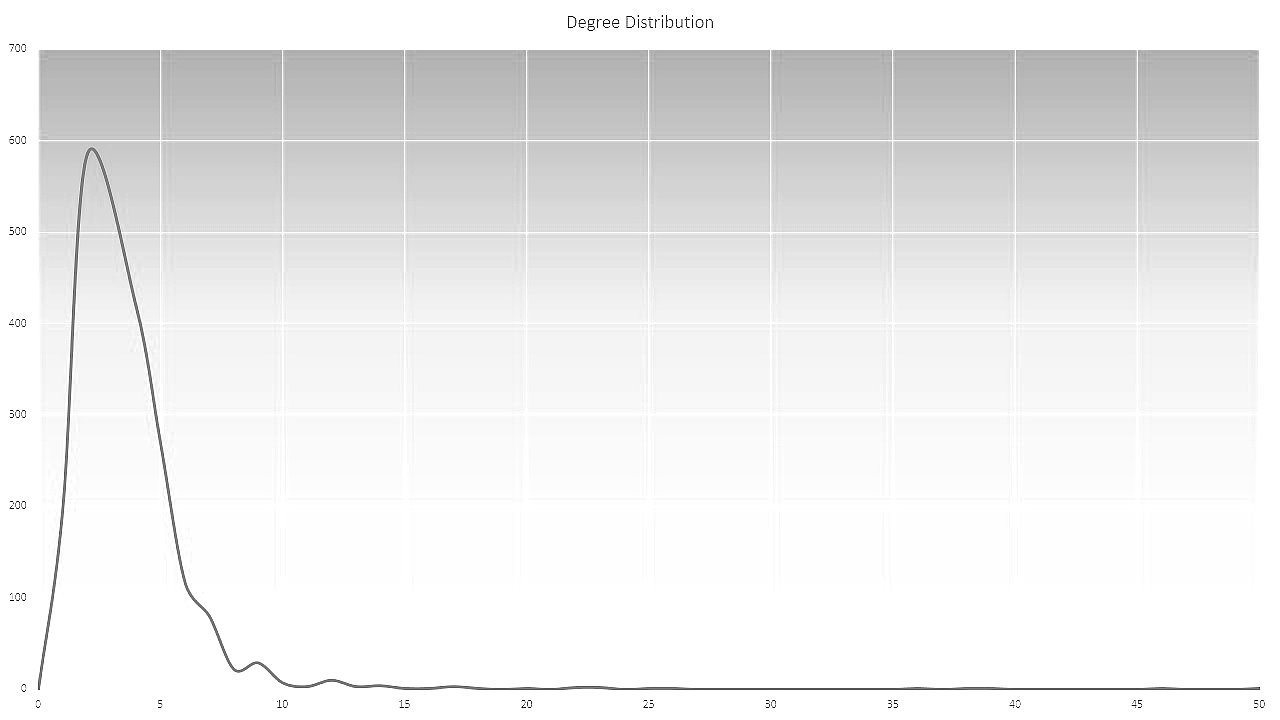 Degree distribution |
|
 Clustering spectrum |
|
 Shortest PLs Spectrum |
|
|
|
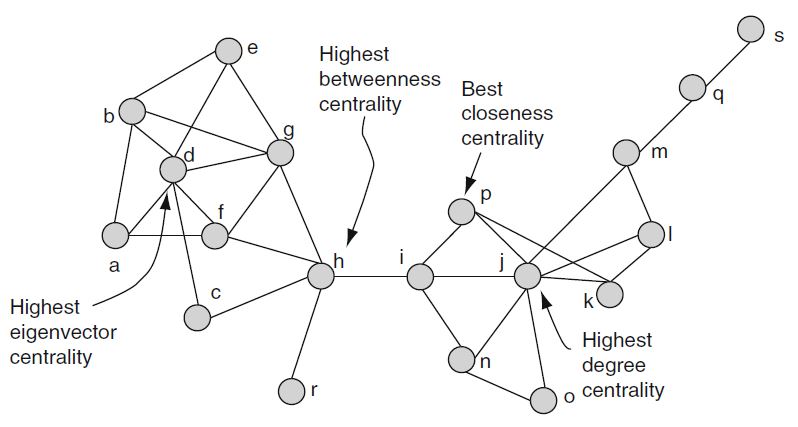 Centrality |
|
Local network |
|
|
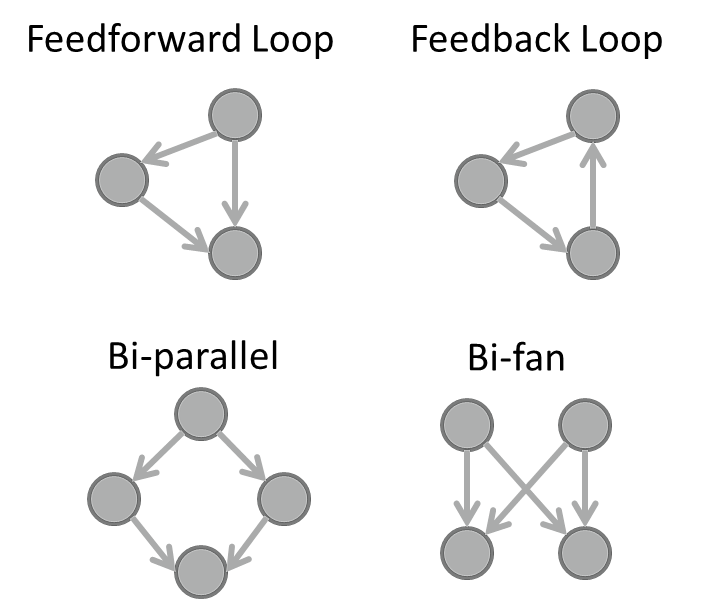 Network motif |
|
Some Important graphs Regular graph: a regular network is a graph where each vertex has the same number of neighbors; i.e. every vertex has the same degree. Random graph: The basic idea of the Erdos-Renyi (ER) random graph is that the degree distribution is binomial. For these networks, the characteristic path length is proportional to the logarithm of the network size, and the average clustering coefficient is inversely proportional to network size. Scale-free graph: The core idea of scale-free networks (which may also called Barabasi and Albert model) is a network whose degree distribution asymptotically approaches the power law (P(k) ~ kγ). Numerous papers claim that biological interaction networks follow a power law. However, firstly, the scale-free network was not based on specific biological considerations. Rather, it is a mathematical model for the dynamical growth of networks that replicates the degree distributions, and some other properties, observed in studies of the WWW and other networks. Small-world graph: A small-world network is a type of mathematical graph in which most nodes are not neighbors of one another, but most nodes can be reached from every other by a small number of hops or steps. Specifically, a small-world network is defined to be a network where the typical distance L between two randomly chosen nodes (the number of steps required) grows proportionally to the logarithm of the number of nodes N in the network, that is: L ~ log N |
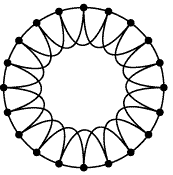 Regular graph 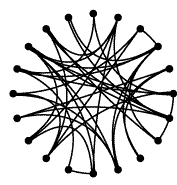 Random graph Scale-free graph 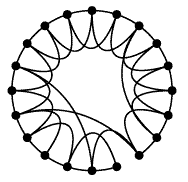 Small-world graph |
|
Note: Texts and figures in this page have been chosen from the following references: West, Douglas B. (2001). Introduction to Graph Theory 2nd ed.). Upper Saddle River: Prentice Hall. ISBN 0-13-01400-2 Oliver Mason and Mark Verwoerd, Graph Theory and Networks in Biologyy A. Abraham et al. Ed., Computational Social Network Analysis, Springer London, 2010 |
|
|
Do you want reading more? There are some comprehensive references which could be helpful in more understanding topological features. We recommend reading the following references for better understanding: |
|